
AI in Chemistry Part 2: Converting Molecular Structure to Graphs
Prepare your chemistry data for Machine Learning algorithms

AI AND CHEMISTRY: IS THERE A SCOPE?
Combining AI/ML with Chemical structures can be complex but really helpful in fields such as drug discovery, nanotechnology, material sciences etc. And I’m not just taking about summarizing books and papers using language models (although, in my experience, relying blindly on language models without human verification might end up being counterproductive). I’m talking about actually leveraging ML models for their predictive and generative capabilities. Think estimating properties of newly discovered molecules before testing it out in the labs, think identifying possible adverse reactions in drug discovery, think designing new materials that meet your requirement for thermal resistance - there is so much to this field and we are just getting started!
Listing down some actual use-cases below:
In drug discovery, machine learning could be leveraged to scan though large datasets of genomic data, disease databases with the objective of identifying a list of potential target proteins to test out drug interaction
In material sciences, models trained on chemical structures could be used to predict molecular properties. Only a handful of structures that fit the desired range of properties could be used for actual testing.
Molecular property prediction could also help predict issues such as material interactions, toxicity and side-effects which are important factors to consider for biomaterial discovery and drug design amongst other things
HANDLING CHEMISTRY DATA FOR AI/ML
The main pain point while working on chemistry-based AI/ML problems is handling molecular structures. Properties of molecules such as melting point, boiling point etc. can easily be represented using tables, but molecular structures hold a lot of information and since they’re not strictly images or texts, we need to take a different approach to handle them.
Broadly speaking there are two ways to handle molecule structures:
String based approach: Molecule structures are digitized as SMILES and InChi notations – both of these representations are string formats. In the previous part we have discussed how SMILES store molecular structures. SMILES can be directly used in sequence-to-sequence models like transformers (with some preprocessing of course!). If you’re looking for data online, you’re most likely to stumble onto String-based representation (specifically SMILES)
Graph based approach: This is our primary topic for today! We’ll discuss how molecules are represented using adjacency matrix where two nodes (here atoms) share a connection. Adjacency matrix is a commonly used format for storing graph information for use in AI/ML algorithms.
Graphs are a more natural way of representing chemical structures - where atoms become nodes and the bonds become edges of the graphs. And that’s not all, graph representations help you leverage graph-based models like Graph Neural Networks and Graph Convolutional Neural Networks directly, making handling chemistry data a tad simpler!
Defining the term “Graph”
A graph is a structure which represents a collection of entities (nodes) and their relationships (edges). Entities can be anything – for instance, a group of people can be represented as a graph where each individual person forms a node and the edges describe their relationship. For molecules, we’ll think of the nodes as the atoms and the edges as bond information.
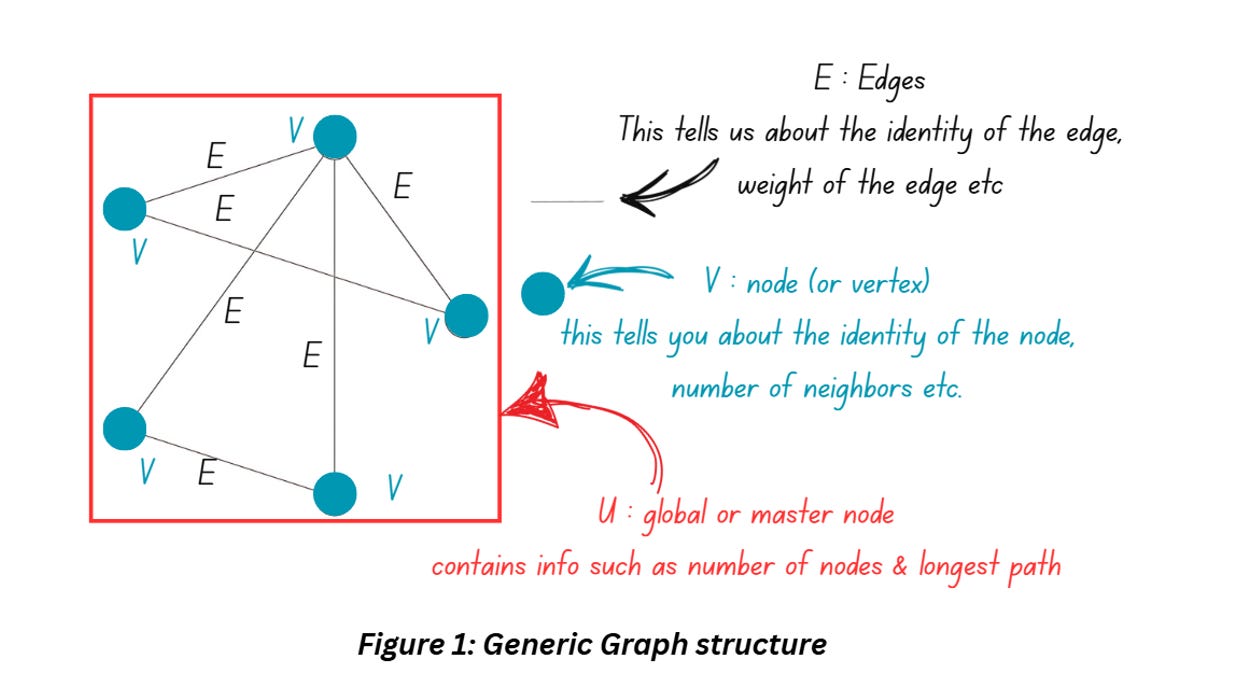
Figure 1 shows how a graph generally looks like. You can add more information to the graphs by adding arrows to the edges (the example shown above has undirected edges, if you add an arrow, it’ll be termed as directed edge). You can also include additional information about each node (and call it attributes of that note).
Adjacency Matrix
Mathematically speaking, the adjacency matrix (also known as connection matrix) is the matrix representation of a simple labelled graph. The rows and columns of the adjacency matrix represent the vertices of the graph. In a simple, unweighted adjacency matrix position in the matrix is filled with either 0 or 1 where 1 indicates that the vertices are connected and 0 indicates that they are not.
The graph shown in Figure 1 is great for visualization but it doesn’t help much if you want to train a machine learning model on it. While there other approaches to represent graphs, adjacency matrix is a popular option. Check out Figure 2,
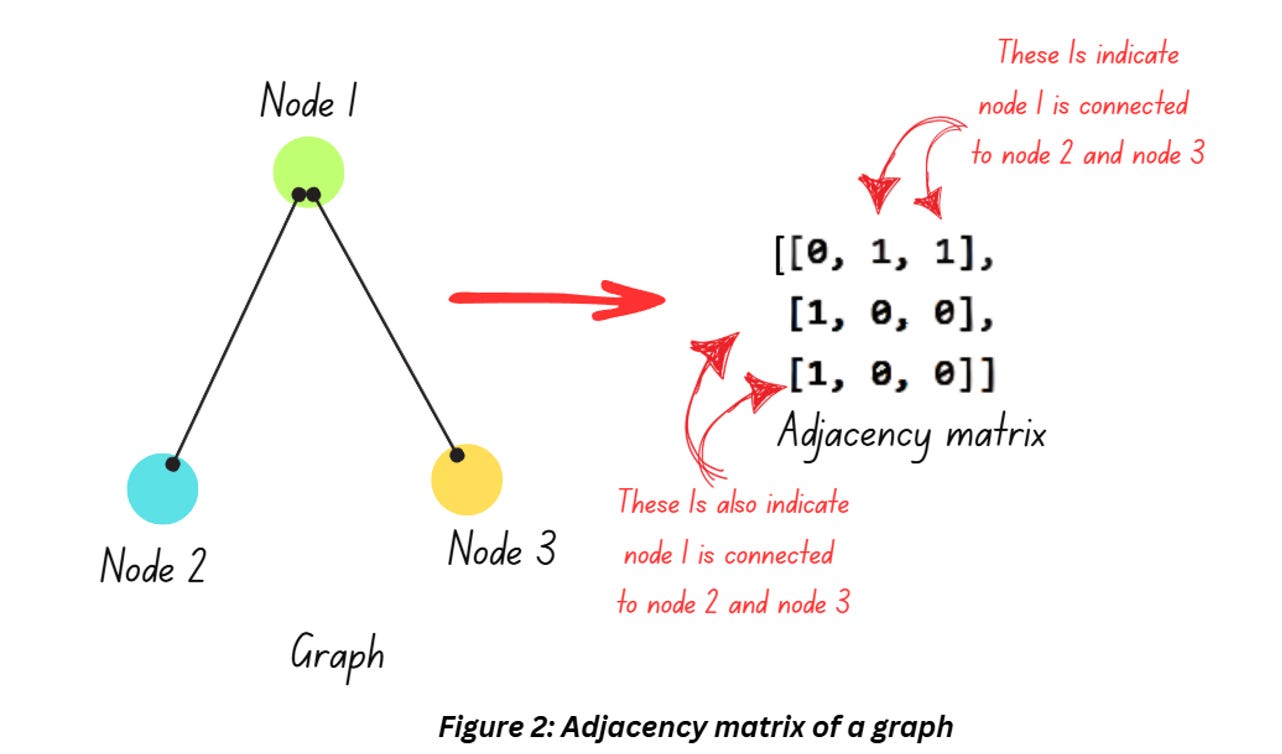
The graph in Figure 2 displays the relationship between 3 entities (denoted as nodes) and its mathematical representation in from of an adjacency matrix. Interpret the matrix like this – Node 1 is connected to Node 2, hence positions (1,0) and (0,1) are 1. Similarly, Node 1’s connection to Node 3 is denoted by the 1 in positions (2,0) and (0,2).
Notice how the adjacency matrix only tells us about the connections but leaves us clueless about the importance of these connections (which we will have to consider while dealing with molecules). This is addressed by weighted graphs and weighted adjacency matrices. In a molecular structure, atoms are connected to each other through bonds and information regarding the bonds like the type of bond, bond length etc. are essential information that cannot be compromised on. In such cases we have to use a weighted adjacency matrix which we’ll discuss in the next section.
REPRESENTING MOLECULES
Molecules as Graphs
Molecules naturally have a structure that appears like graphs. For instance, check out the image below,
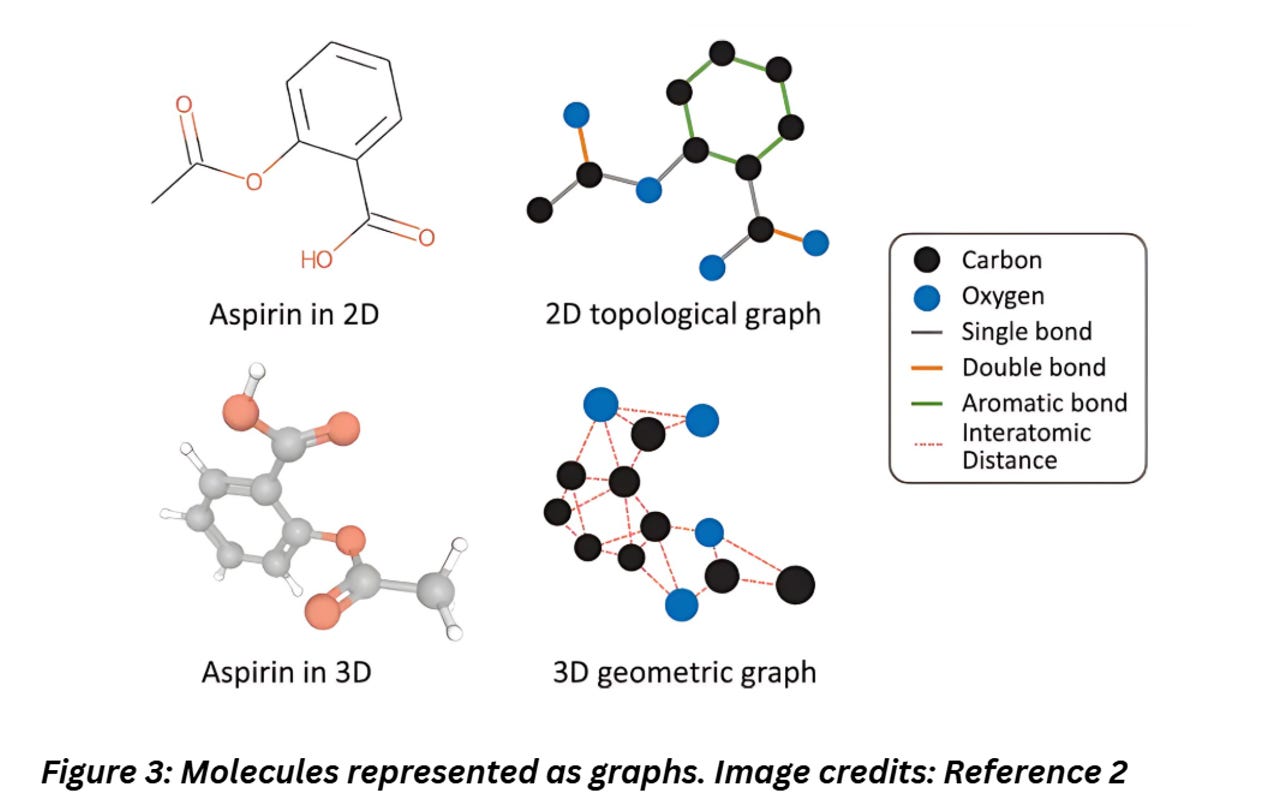
Figure 3 shows how easily complex molecules can be represented as graphs. The atoms can be represented as nodes, the edges as bonds. Each node can be tagged with attributes like properties of the atom like atomic weight and edges can store information on the type of bonds, interatomic distance etc.
Molecules as Adjacency Matrix
Now let’s see how a molecular graph looks like when represented as an adjacency matrix,
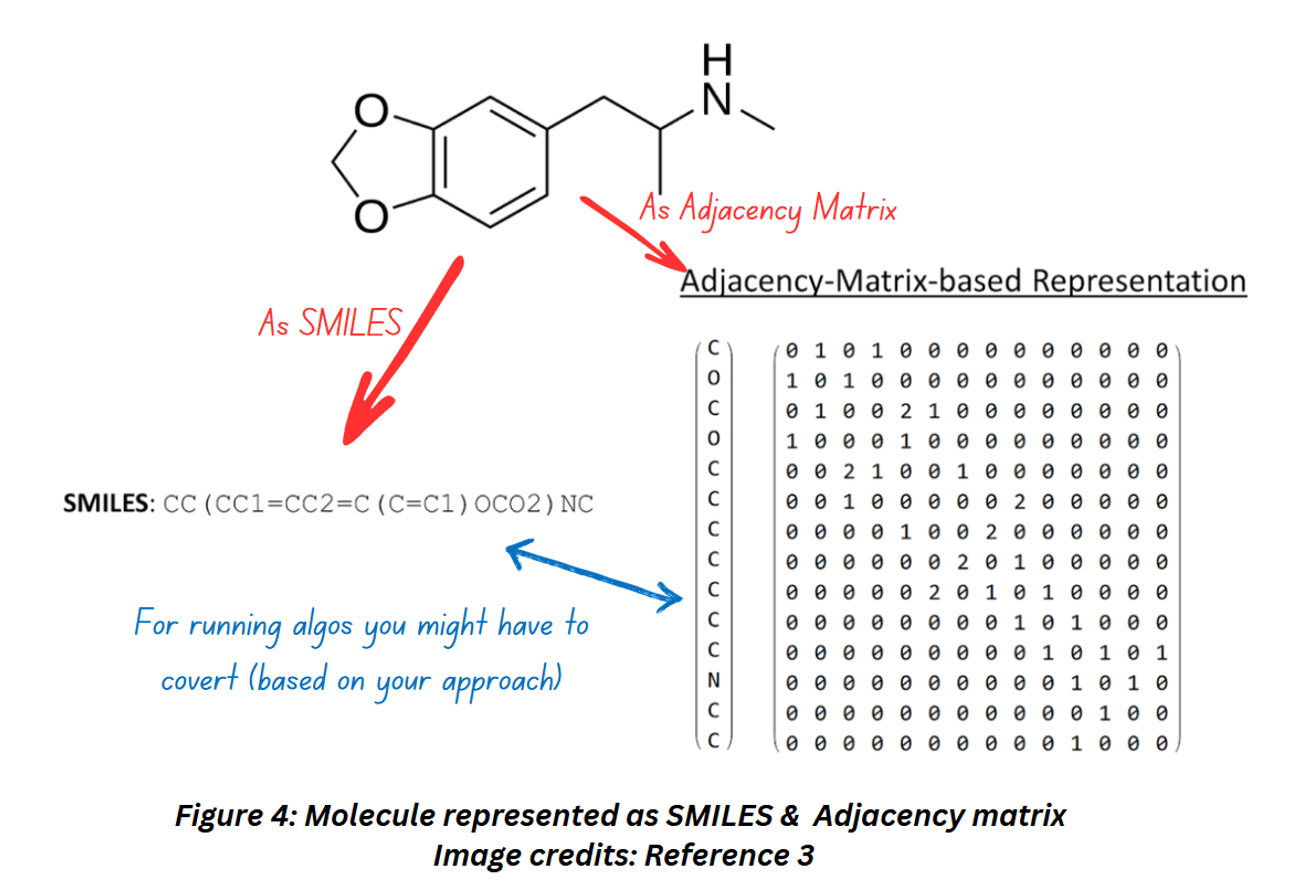
Figure 4 shows how a molecule can be represented as a string (SMILES) and an adjacency matrix. Notice how this particular adjacency matrix includes 0, 1 and 2. If you compare the molecular structure with the adjacency matrix, you’ll notice that 2s are filled whenever two atoms are joined together by double bonds.
SMILES vs Adjacency Matrix
From Figure 4 it might appear that SMILES and Adjacency matrix (which is the graph representation format for storing molecular structure digitally) capture the same amount of information and the difference lies in the format only – but that’s not how it is!
SMILES strings are complex to handle and process (which can impact the efficiency of transformer-based models which are the go-to method for processing SMILES) and might also be prone to producing incorrect molecular syntax.
On the other hand, graph representations (adjacency matrix) makes the representation simple and ready for processing in GNNs (graph neural networks) but they fail miserably when it comes to representing 3-D structures and we end up missing out on a lot of chemical properties that are linked to the 3-D structures.
FAQs
Are there any other alternatives to represent molecular structures?
As a matter of fact, there are. In the previous part we have discussed InCHI which another string-based representation which represents much more information than SMILES and create more syntactically correct representations as well, but if complexity of representation is the issue then SMILES still wins the race. There’s also DeepSMILES which was developed to handle the syntax related issues with SMILES – it does address some of the issues with SMILES but not all of them. SELFIES is a new format designed keeping in mind the challenge with molecular syntax which especially gets amplified if you intend on using SMILES with generative models. Reference 3 is authored by the team developing SELFIES so feel free to check it out!
On the graph front, Reference 11 talks about a Connectivity matrix which is similar to Adjacency matrix with the difference being that Connectivity matrix represents information regarding the geometry of the molecule, i.e. the spatial relationship between the atoms.
How is molecular data commonly available online?
At this point (Nov 2025) SMILES appears to the most widely adopted format. So based on the approach SMILES will have to be converted to other formats. Many algorithms for molecular data processing are also designed around SMILES and Adjacency matrix formats, it is fairly easy to swap between the formats.
REFERENCES
GraphNN introduction: https://distill.pub/2021/gnn-intro/
Machine learning in molecular sciences: https://link.springer.com/chapter/10.1007/978-3-031-37196-7_2
Molecular graph representations:

BERT based molecular structure extraction: https://jcheminf.biomedcentral.com/articles/10.1186/s13321-024-00848-7
SMILE2BERT for molecular property prediction: https://www.biorxiv.org/content/10.1101/2024.10.31.621293v2
Graph Data Modelling for Molecules, University of Toronto: https://pubs.acs.org/pb-assets/in-focus/preview/preview-2025-Graph-Data-Modeling-Molecules-Proteins-Chemical-Processes-Sanchez-Lengeling-1757001507950.pdf
Discussion: converting graphs to adjacency matrix: https://mattermodeling.stackexchange.com/questions/6756/given-the-adjacency-matrix-of-a-molecule-how-can-i-get-a-graphical-representati
Computer representation of chemical bonds: https://server.ccl.net/cca/documents/molecular-modeling/node3.html
Medium- Molecular representations for machine learning: https://medium.com/data-science/basic-molecular-representation-for-machine-learning-b6be52e9ff76
Adjacency Matrix: https://mathworld.wolfram.com/AdjacencyMatrix.html
Connectivity Matrix: https://server.ccl.net/cca/documents/molecular-modeling/node3.html