
AI In Chemistry Part 3: Graph Features for Machine Learning
An overview of feature extraction handcrafted for Graph datasets

So far in the series, we’ve discussed the different formats for digitally representing Molecular Structure and we’ve talked about the different approaches for using Molecular Structures in AI/ML, including graph-based representation.
Today’s blog is mostly about graph features, mostly introduced as a precursor of Graph Neural Networks (GNNs).
Why is this an important topic?
When it comes to image processing and traditional ML algorithms, understanding and even visualizing features is relatively straightforward than graph data. Because,
a) We are mostly used to dealing with datasets like tables, text and images in general
b) It is relatively easier to build an intuitive understanding of the data mentioned in point a.
Graphs in ML is not one of the more common topics and building an intuition for GNNs directly is relatively trickly. A sneak-peak into traditional graph features will come handy when we discuss topics like GNNs, especially for complex datasets like molecular structures.
QUICK RECAP
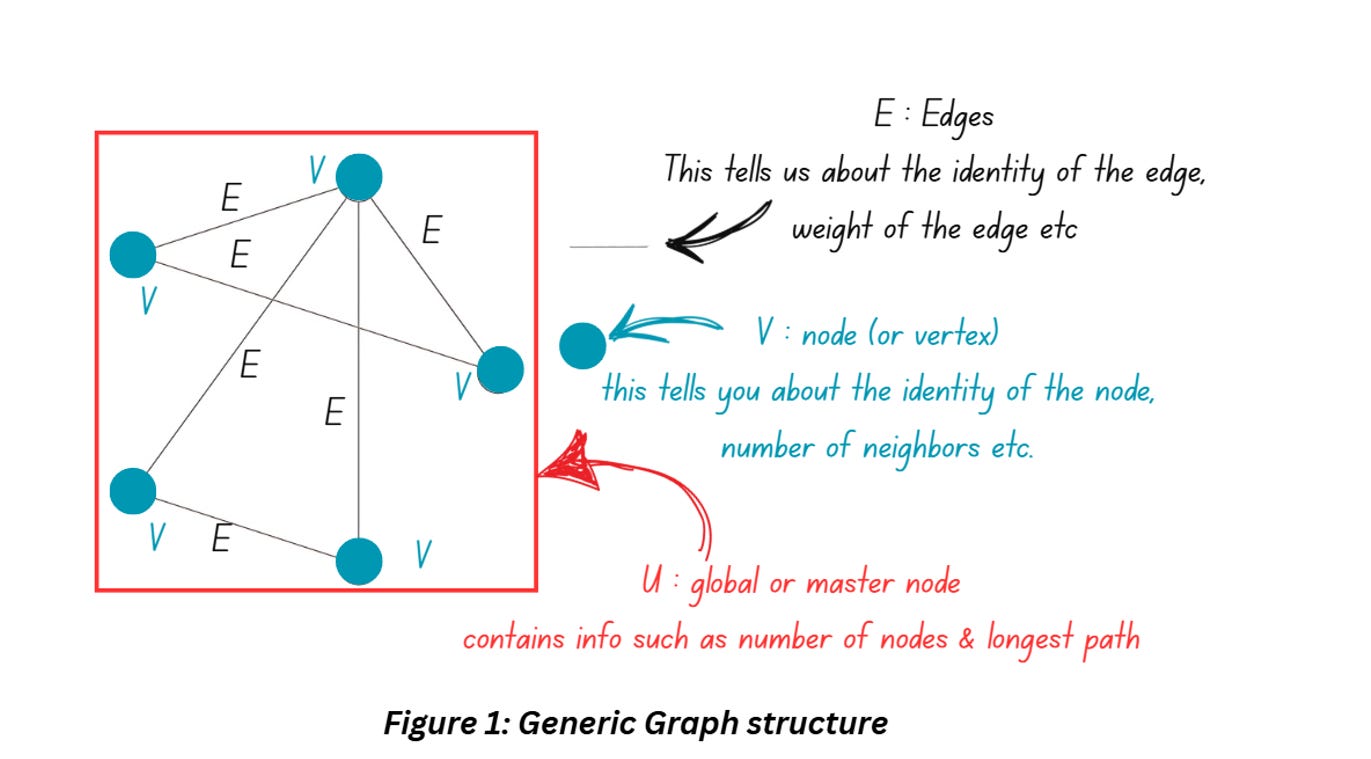
Let’s start by quickly going over the structure of a generic graph that we had discussed in Part 2. Figure 1 shows a graph which is essentially a collection of entities also known as nodes. The nodes are connected using edges that describe the relationship between the nodes. The graph can have additional information such as properties of the nodes and directions of the edges.
Graphs are everywhere
Graphs are inherently very flexible formats and perform very well with complex, unstructured and irregular data (think social media graphs, chemical structures) – basically the kind of data that Neural Networks find it hard to handle. Technically you can use graphs to describe images and text data as well but GNNs do tend to perform better than conventional machine learning/deep learning when the structure and relationship between datapoints is an important datapoint to consider.
For example, if you’re working with chemical structures, what atoms are present is as important as how the atoms are connected and what type of bonds exist between the atoms – in such cases conventional deep learning approaches hit the wall and graph-based approaches may be the better choice!
GRAPH-BASED PREDICTIVE MODELING
Graph can be used for the following types of predictive modeling tasks,
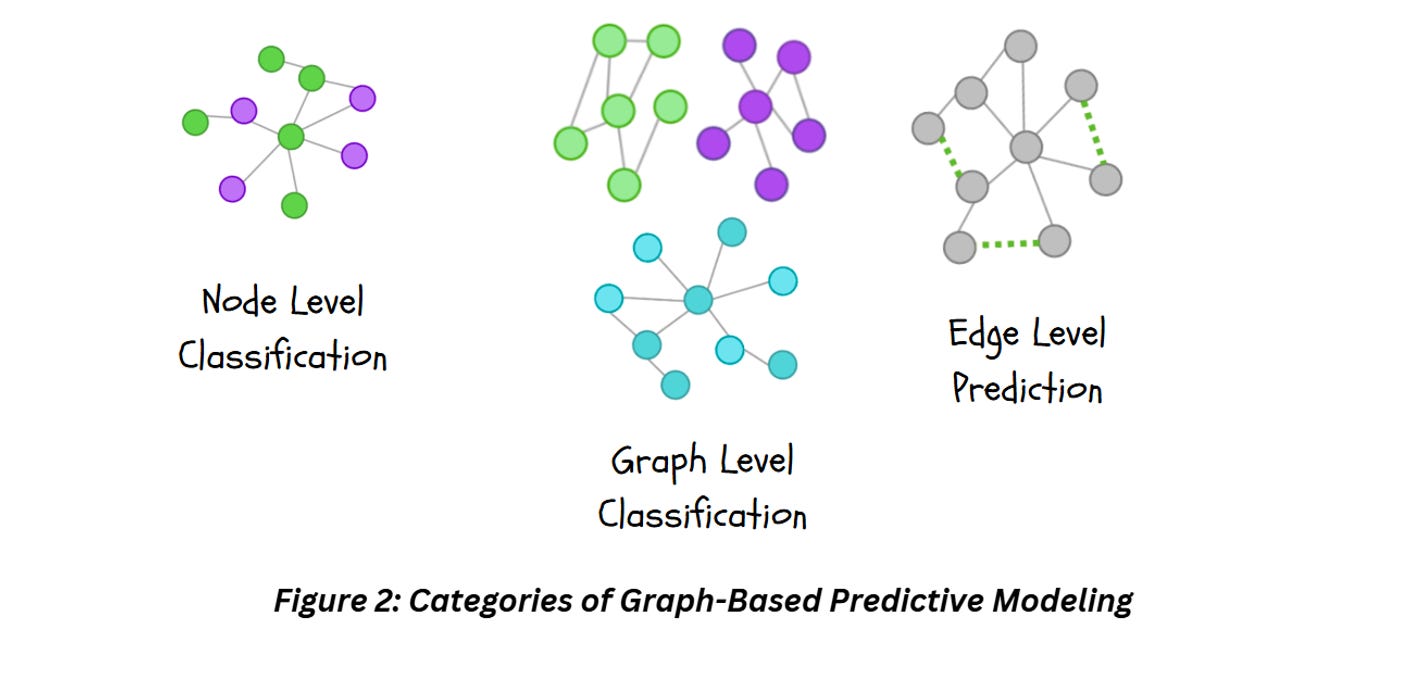
Graph Level Prediction: Our objective in this case is to use the entire graph as input and predict properties at a graph level. A good example for this will be molecular property prediction task where you convert chemical structures saved as SMILES into a graph and use it to predict certain properties (ex. Toxicity, Solubility etc.) of the entire graph. Graph level prediction can include graph level classification, regression and clustering where the objective is to classify an entire graph, predict a value from the entire graph or cluster a number of graphs.
Node Level Prediction: Our objective in this case is to get outputs for nodes within a graph. This can include node level classification, i.e., assigning classes to different nodes (for example take a social media graph and identify which members are related), or node level regression (ex. for an org level graph, predict the performance score for each employee). In this case, you’re focused on individual nodes instead of the entire graph.
Edge Level Prediction: In this case, we predict the relationship between the nodes. For example, suggesting new friendships in a social media graph.
While we are discussing predictive tasks specifically, I’d like to point out that graphs can also be used for Generative Tasks but we’ll cover that in a different set of articles.
GRAPH FEATURES FOR CLASSICAL MACHINE LEARNING ALGORITHMS
Prior to GNNs, the traditional approach to train ML models on graph data involved the use of handcrafted features, just like classical ML models. The features can be approximately grouped into three different categories based on the approach. I’ve listed these down along with a few examples below,
Graph Statistics and Kernel methods
Very similar to classical feature extraction methods on tabular or image data, these approaches involved extracting certain stats or features based on domain specific information etc. and feeding these extracted features to a classical ML model like linear regression, random forest etc. This category of features can be further subdivided into node-level features (features extracted on individual nodes) and graph-level features (extracted on entire graphs).
A simple example for node-level features would include computing the node degree, i.e., number of edges connected to a node. As for graph-level features, a straightforward feature extraction technique would be to aggregate node-level stats (also called bag of nodes).
Neighborhood Overlaps
These features quantify the relationship between pairs of nodes with the objective of understanding the relationship between them. Just like Graph Stats, you have node level and graph level versions. One example under node level neighborhood overlap would be the Sorensen index which basically normalizes the count of neighbors by the sum of the node degrees. Katz index, which involves counting the number of paths of all lengths between a pair of nodes would be an example of global overlap statistic.
Graph Laplacians and Spectral Methods
These approaches help in learning the lower dimensional embeddings in the graph – also handy when the objective is to cluster the graph. Some of the approaches under this category include Graph Laplacians which are formed by performing transforms on the adjacency matrix explained in Part 2. In short, the eigenvector of the Laplacian matrix indicates which nodes are connected in the graph (we will have to dedicate an entirely separate article to cover this!) – this can be further used to cluster the graph based on how they are connected.
SUPER QUICK INTRODUCTION TO GRAPH NEURAL NETWORKS
By now, you might have noticed that the feature extraction approaches I’ve mentioned above are just a handful of the many that exist. Depending on your task, you can use a bunch of these and construct a feature vector which you can use to train your machine learning models. But while handcrafting feature vectors, there’s always the question of what combination of features will work the best. If you’re dealing with Chemistry data, you’ll already have the additional task of figuring out which of these features even make sense in the domain of chemistry. Wouldn’t it be easier if we could shift our focus from the feature engineering aspect and focus on the model training (which won’t be an easy task either, trust me)!
If you’ve worked with image data, you might have noticed Deep Learning (specifically CNNs) solved the exact problem for image processing tasks. Instead of handcrafting features, CNNs are trained to tweak the kernel weights which automatically extracts the best possible features for the given dataset and task at hand. GNNs has the same purpose, just with graph data.
Designing deep learning architectures for graphs isn’t that straightforward – images and text data have defined structures and sequences, something that is completely absent in graphs. And let’s not forget about the individual properties of the nodes! GNNs were designed considering all of these aspects in mind!
In the next part, we’ll specifically discuss Graph Neural Networks, before moving on to training GNNs on chemistry data.
REFERENCES
A Graph Convolutional Neural Network Approach to Antibiotic Discovery: https://www.welcometothejungle.com/en/articles/btc-covid19-convolutional-neural-network
ChemProp: https://github.com/chemprop/chemprop
Deep Learning Approach to Drug discovery paper: https://www.sciencedirect.com/science/article/pii/S0092867420301021
GNN lecture:
Graphs Representational Learning Book: https://www.cs.mcgill.ca/~wlh/grl_book/files/GRL_Book.pdf